
Setting Reorder Points When Demand Isn't Steady
Reorder point equals average daily usage multiplied by average lead time, plus safety stock. For distributors with lumpy demand, calculate that buffer using your maximum daily usage and maximum lead time, then subtract the average case. This protects against the worst realistic delay, not the typical one.
Your purchase manager reorders bearings when the bin looks low. Sometimes that's three weeks before the shelf would have run out. Sometimes it's two days after it already has. Neither is a system. One ties up capital that could be sitting in your bank account. The other stalls a customer's order while you wait on a vendor who quoted seven days and took fifteen.
This is the reorder point problem, and most of the formulas written about it assume something that isn't true for a distributor: that demand and lead time behave the same way every month. They don't. A hardware distributor sees flat demand for eight months and a spike around a festival or a construction season. An auto-parts distributor's lead time depends on whether the vendor's own supplier in another state is running late. Averages hide both of these. A reorder point built only on averages will feel right on paper and fail on the shop floor.
What is the reorder point formula?
The reorder point is the stock level at which you place a new order, so the replacement arrives before you run out. The standard formula is:
Reorder point = (average daily usage × average lead time) + safety stock
This is the version you'll find in most inventory guides, and it's correct as far as it goes (Lightspeed's breakdown covers the basic mechanics well). The part that decides whether it actually works for you is how you calculate safety stock. Get that wrong and the rest of the formula is decoration.
Why does the standard formula fail for most distributors?
Because it assumes one number represents daily usage and one number represents lead time, when in reality both move around, and for a trading or distribution business they rarely move together. Demand for a fastener, a fabric roll or a spare part isn't a smooth line. It's flat for weeks, then a contractor places a bulk order, then flat again. Lead time isn't fixed either: a vendor's quoted seven days becomes twelve when their own input is delayed, or when the transporter has a backlog around a state holiday.
The standard formula, applied with plain averages, gets both of these wrong at once. It underestimates how much you'll need on the days demand spikes, and it underestimates how long you'll be waiting when the vendor slips. Here's where each version of the formula stands:
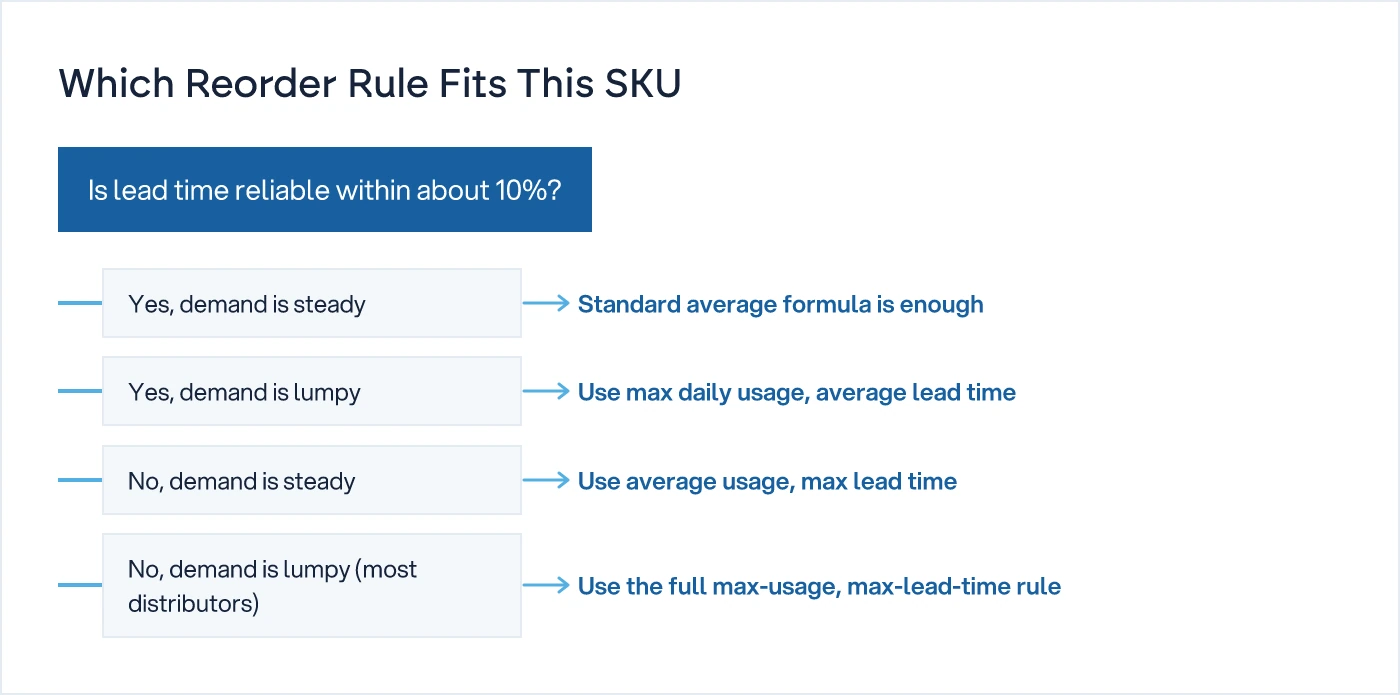
| Situation | Does the standard formula work? | What to use instead |
|---|---|---|
| Steady demand, steady lead time | Yes | Average usage × average lead time |
| Steady demand, variable lead time | No, understates risk | Average usage × maximum lead time |
| Lumpy demand, steady lead time | No, understates risk | Maximum usage × average lead time |
| Lumpy demand, variable lead time (most distributors) | No, badly | Maximum usage × maximum lead time, minus the average case |
If you sell to workshops, retailers, contractors or project sites, you're almost certainly in the last row.
How do you calculate reorder point when demand is lumpy?
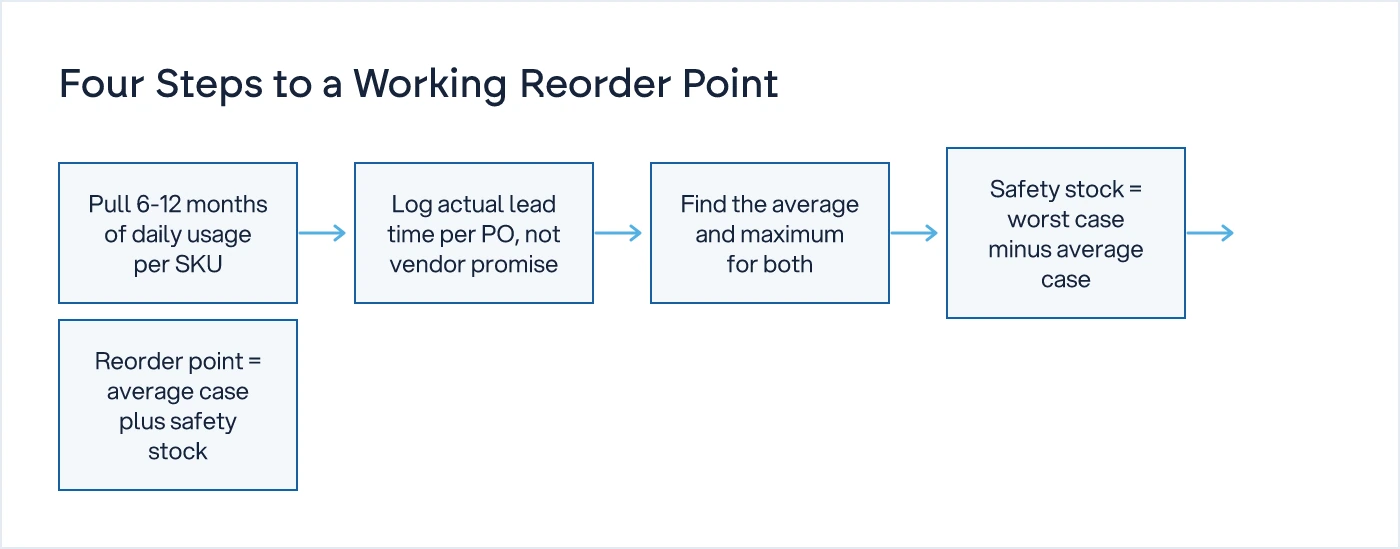
Use this rule: safety stock is the gap between the worst realistic case and the average case, calculated separately for usage and for lead time, then combined.
Safety stock = (maximum daily usage × maximum lead time) − (average daily usage × average lead time)
Reorder point = (average daily usage × average lead time) + safety stock
This is deliberately more cautious than a statistical safety-stock calculation built on standard deviation, and that's the point. Standard deviation assumes demand clusters around an average in a roughly predictable spread. Lumpy demand doesn't behave that way; it sits flat, then jumps. A formula that assumes a bell curve will understate your real exposure. Using the maximum recorded usage and the maximum recorded lead time, drawn from your own last 6-12 months of data rather than a vendor's promise, gives you a number you can defend to whoever signs the purchase order (background on lead-time treatment is covered in this piece on safety stock and lead time).
What does this look like for a real SKU?
Take a brake pad line carried by an auto-components distributor. Over the last year:
- Average daily usage: 25 units
- Maximum daily usage (monsoon season, one model in demand): 60 units
- Average lead time from the vendor: 10 days
- Maximum lead time recorded (a vendor delay out of a Coimbatore supplier): 18 days
Safety stock = (60 × 18) − (25 × 10) = 1,080 − 250 = 830 units
Reorder point = (25 × 10) + 830 = 1,080 units
That's a large number relative to average usage, and it should be. It's covering the case where a demand spike and a vendor delay land in the same window, which is exactly the scenario that empties a shelf. If 1,080 units ties up more capital than the SKU justifies, that's useful information too. It tells the owner this line either needs a second vendor to shorten the worst-case lead time, or it needs a tighter, more statistical safety-stock method reserved for capital-intensive SKUs, not the conservative rule used everywhere else.
Not every SKU needs the full version of this rule. Fast-moving, steady lines with a reliable vendor can run on the plain average formula. The decision of which rule applies to which SKU shouldn't be made on the fly by whoever happens to be placing that day's order.
How much lead-time buffer is enough?
Enough to cover the gap between your average and your worst recorded lead time over the last twelve months, not the lead time the vendor quotes at the start of the relationship. Vendor-quoted lead times are marketing. Actual lead time is the number of days between the purchase order date and the date stock physically arrived and was checked in. If nobody is logging that second date, you don't have lead-time data, you have a vendor's opinion.
Start tracking actual receipt dates against PO dates for your top 30-40 SKUs by value. Three months of this gives you a real average and a real maximum, which is what the formula above actually needs.
How often should you recalculate the reorder point?
Quarterly for most SKUs, monthly for anything seasonal or single-sourced. Demand patterns shift with the season, a new contract, or a competitor's pricing move, and a reorder point set in January on last year's numbers will be wrong by July. Seasonal lines, and anything you buy from a single vendor with no backup, deserve a monthly look because the cost of being wrong is higher.
If the reorder decision for a SKU still depends on someone remembering to call the vendor and ask what's realistic this month, that's not a system, it's a habit that survives until the person holding it takes leave. If the answer needs a phone call, it's not a system.
The other failure mode worth naming: setting reorder points too generously across the board as a hedge against ever running short. That's how safety stock quietly turns into the dead stock sitting in the warehouse a year later. If you haven't measured how much of your current stock falls into that category, this piece on identifying dead stock is the place to start before you tighten reorder points further.
What if you don't have lead-time data yet?
Start logging it this week and use a temporary conservative rule until you have three months of real numbers. Until then, set the reorder point using your best estimate of maximum usage and the longest delay you can recall in the last year for that vendor, and treat it as provisional. A rough number built on judgement, reviewed monthly, beats a precise-looking formula built on a vendor's quoted lead time that nobody has verified.
Once reorder points are set correctly, the capital they free up is real money, and it matters just as much as collecting what customers owe you on time. If working capital is the constraint behind this exercise, it's worth reading alongside receivables ageing tracking, since both are levers on the same number: cash tied up versus cash available.
What to do this week
Pick your top 20 SKUs by value or by how often they've caused a stockout in the last year. For each, pull actual usage and actual lead time data, not vendor quotes. Run both formulas from the table above and see how far apart they land. Where the gap is large, that's the SKU where guesswork has been costing you, either in tied-up capital or in a customer waiting on an order that should have shipped.
We understand how your business actually works first, then we design the system. If reorder points, purchase approvals and stock visibility are still living in someone's head or a spreadsheet nobody trusts, that's the starting conversation, not a software brief. More on how we approach this is on the digital transformation service page, and for the wider set of issues distributors are working through right now, the distribution, trading and wholesale operations hub is the place to browse next.
Common questions
What is a safety stock formula for lumpy demand?
Use safety stock = (maximum daily usage × maximum lead time) − (average daily usage × average lead time). This is more conservative than standard-deviation-based methods, which assume demand clusters predictably around an average, an assumption lumpy demand breaks. Pull the maximum figures from your own last 6-12 months of actual sales and receipt data, not vendor promises.
Is reorder point the same as safety stock?
No. Safety stock is the buffer quantity held to cover uncertainty in demand and lead time. Reorder point is the trigger level at which you place a new order, and it's calculated as average usage during lead time plus safety stock. Safety stock is one component that feeds into the reorder point, not a separate number you track alongside it.
How do I calculate reorder point without an ERP or WMS system?
You can calculate it in a spreadsheet if you have accurate usage and receipt-date data. Track daily quantity sold per SKU and the actual date each purchase order was received, not the date it was promised. Three months of this gives enough of a sample to compute average and maximum usage and lead time, which is what the formula needs regardless of the system running it.
Should reorder points differ by SKU class (A, B, C)?
Yes. High-value or capital-intensive A-class SKUs justify a tighter, more precise method since every unit of safety stock ties up meaningful cash. Fast-moving, low-value C-class SKUs can usually run on the simpler average-based formula, since the cost of a slightly oversized buffer is small. Reviewing every SKU with the same rule wastes effort where it isn't needed.
How does import or transporter delay affect reorder points in India?
It widens the gap between average and maximum lead time, which is exactly the number this rule is built to capture. If a SKU depends on an imported component or a single transporter route prone to delay, log the actual worst-case lead time you've experienced over the last year and use that, rather than the vendor's or forwarder's quoted transit time.
Sources

Sanket Vanani
Founder & CEO
Sanket Vanani is a business strategist and entrepreneur focused on helping businesses build structured systems for sustainable growth. His work spans sales, operations, manufacturing, process improvement, and business scalability. Through his experience working closely with business owners and teams, Sanket focuses on turning founder-dependent businesses into process-driven organizations that can grow with greater clarity, consistency, and control.
Related reading

Dead Stock: How Much Is Sitting in Your Warehouse
Dead stock isn't a stock problem. It's a decision no one owns. Here's how to find it and who should be signing off the write-off.

Receivables Ageing: Catching Bad Debt Before Month-End
Month-end ageing reports arrive too late for a trading business. Here is how to review receivables weekly and stop bad debt before it compounds.


