
OEE Explained: What It Measures and What It Hides
OEE measures how much of a machine's planned production time is used to make good parts, at the right speed, first time. It multiplies Availability, Performance and Quality into one score. The formula is easy to calculate; stopping each component being quietly manipulated is the real work.

What is OEE and how is it calculated?
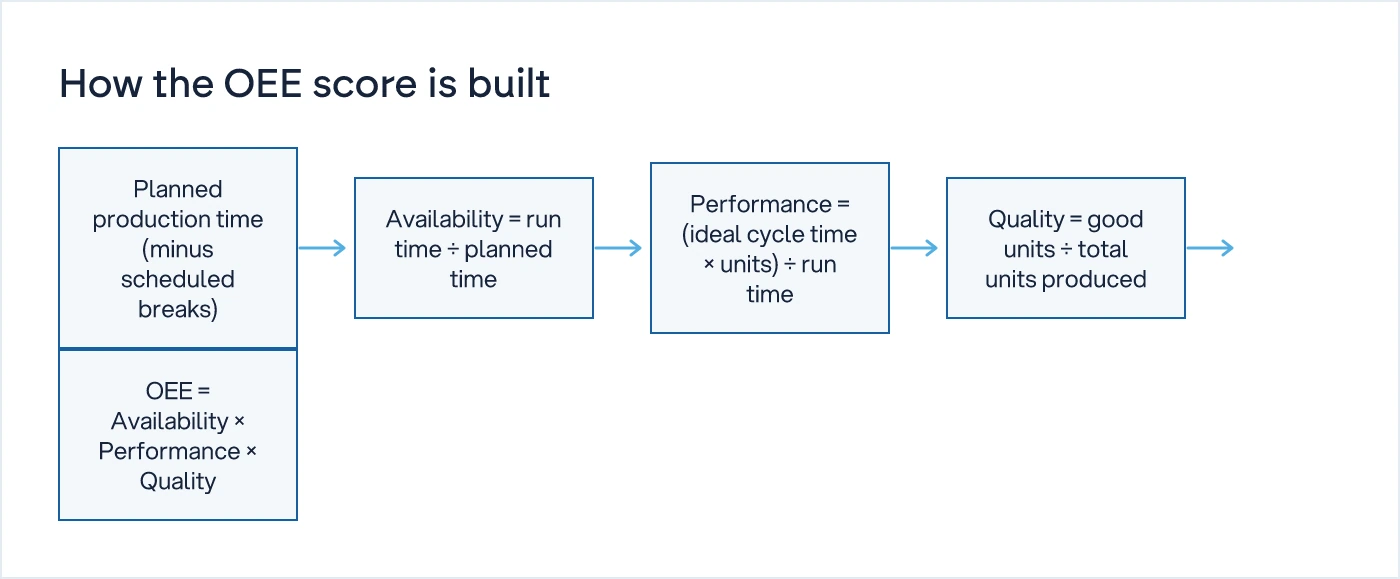
OEE (Overall Equipment Effectiveness) tells you what fraction of a machine's planned production time actually produced good parts, at full speed, on the first attempt. It is calculated as:
OEE = Availability × Performance × Quality
- Availability = Run time ÷ Planned production time. If a machine was scheduled to run for 8 hours and actually ran for 6, availability is 75%.
- Performance = (Ideal cycle time × units produced) ÷ Run time. If the machine can make a part every 10 seconds but is actually averaging 13 seconds, performance is below 100%.
- Quality = Good units ÷ Total units produced. If 500 pieces were made and 40 were scrapped or reworked, quality is 92%.
Multiply the three together and you get a single number. A machine running at 90% availability, 95% performance and 98% quality has an OEE of roughly 84%, which most benchmarks would call close to world class.
The formula itself is not the hard part. Any plant engineer can calculate it from a shift log in ten minutes. What's hard is making sure the inputs to that formula are honest, because each of the three numbers can be adjusted without anyone touching the machine.
What does a good OEE score actually look like?
A single OEE number tells you almost nothing without knowing how it was built. Two lines can both report 70% and be in completely different states.
| OEE score | How it's usually read | What it can actually mean |
|---|---|---|
| 85%+ | "World class" | Often genuine, but check if micro-stops and changeovers are included in the denominator |
| 60-75% | "Typical, room to improve" | Could be real losses, or could be a line where cycle time is set loose and stoppages under 5 minutes are not logged |
| Below 50% | "Needs urgent attention" | Sometimes the most honest number on the floor, because nobody has bothered to groom it yet |
| Same score every week | "Stable performance" | A number that never moves is more often a sign it isn't being recalculated from real data each shift |
A benchmark figure often cited for discrete manufacturing puts world-class OEE at around 85%, with the average plant running well below that (oee-benchmark.org). That benchmark is useful as a reference point. It is not useful as a target that a shift supervisor is told to hit, because a target attached to someone's pay is a target someone will find a way to reach on paper.
Where does OEE get gamed on the shop floor?
It gets gamed inside each of the three components, usually by the person closest to the data entry, not out of dishonesty but because the metric is tied to something they're judged on.
Take a press line running three shifts. The plant head sets an OEE target of 65% for the quarter and links part of the shift supervisor's incentive to it. Six weeks later the number has climbed to 70%. The machine hasn't changed. Here is what usually has:
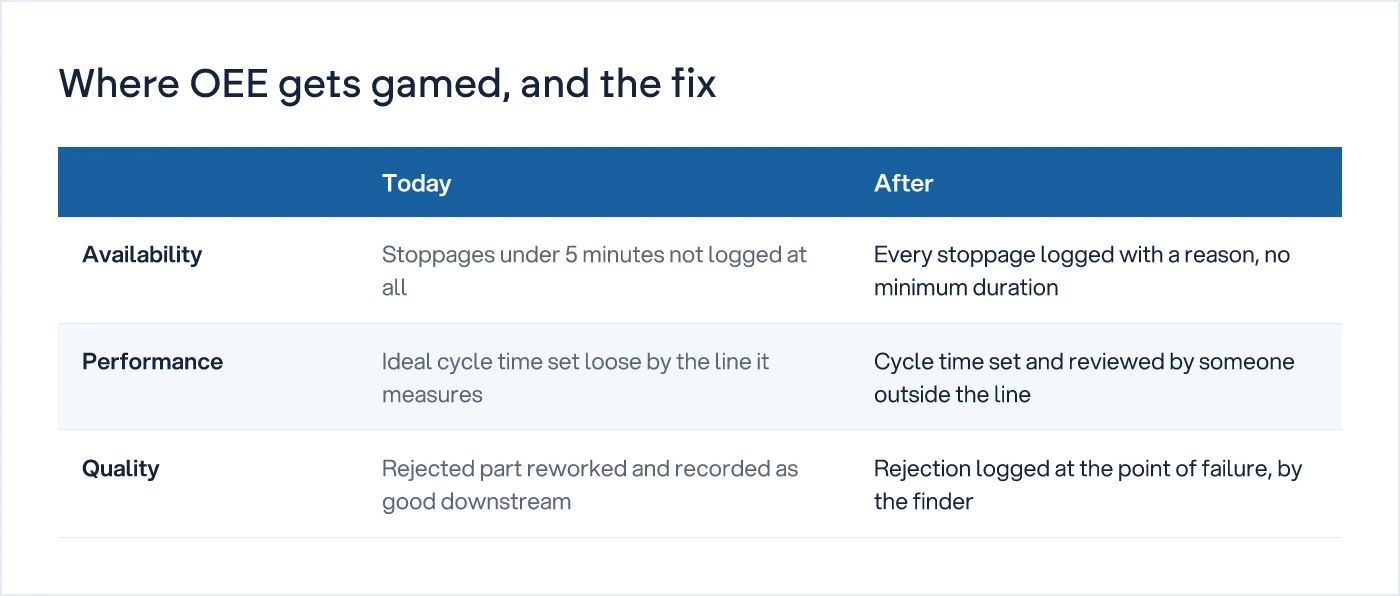
Availability gets padded by reclassifying stoppages. A 12-minute changeover gets logged as "planned maintenance" instead of downtime, so it never counts against run time. Stoppages under 5 minutes, tool checks, minor jams, stop for a quick instruction from the supervisor, often aren't logged at all because the system only prompts for a reason above a threshold. On a line with twenty such stops a shift, that is over an hour of unrecorded downtime a day.
Performance gets padded by resetting the ideal cycle time. If the machine can genuinely run a part every 10 seconds but the standard in the system is set at 13 seconds, every shift that runs at 12 seconds now shows as exceeding 100% performance. Nobody lied about the output. The yardstick moved.
Quality gets padded by where rejection is counted. A part that fails inspection at the press gets reworked at a bench two stations away and comes back as "good." It was never logged as a reject because the rejection point and the recording point are different people. This is the same failure mode covered in why rejection tracking on the shop floor never sticks: if rejection isn't logged at the point of failure, by the person who found it, it quietly disappears from every downstream number, including OEE.
None of this requires bad intent. A supervisor whose bonus depends on a number will optimise for the number, not for the machine. The dashboard will look better every month. The plant will not actually be running any better.
What should you track alongside OEE so it can't be gamed?
Track the raw events that feed OEE, not just the calculated score, and have someone other than the line under review own the standards it's measured against.
Four things close most of the gap:
- A downtime reason log with no minimum duration. Every stoppage gets a timestamp and a reason, including the 3-minute ones. This is the same discipline covered in tracking machine downtime without an IoT budget, and it doesn't need sensors to start. A paper register with time-in, time-out and reason, reviewed daily, is enough to stop availability being quietly inflated.
- Rejection logged at the point of failure, not at the end of the shift. Whoever finds the defect logs it immediately, before it moves to rework. This closes the quality loophole described above.
- Preventive maintenance adherence tracked separately from OEE. A machine that is "available" because its last service was skipped is not actually healthy; it's a breakdown waiting for a date. The reasons PM schedules get skipped in practice are covered in why your preventive maintenance schedule never gets followed, and that gap doesn't show up in OEE until the machine actually fails.
- Cycle time standards set and reviewed by someone outside the line. If the person whose bonus depends on performance also sets the ideal cycle time, the standard will drift in one direction. A process engineer or plant head should own and periodically re-benchmark it, not the shift supervisor.
The owner's decision here is simple: who sets the ideal cycle time, and who reviews it every quarter. If the answer is "the same supervisor whose number depends on it," the OEE figure cannot be trusted regardless of how good the dashboard looks.
How do you set up OEE tracking without a big IT project?
Start manual, on one line, before you build or buy anything. A spreadsheet with timestamped downtime, cycle counts and rejection by reason, reviewed weekly by someone who isn't the line supervisor, will surface the gaming within a month. Only once that discipline holds on paper does it make sense to digitise it, because a system that automates a loosely defined cycle time or a downtime log with a 5-minute threshold just makes the bad number update faster.
Do not automate a bad process. If the ideal cycle time is wrong, or if rejection is logged two stations downstream of where the part failed, putting that onto a tablet or a dashboard does not fix it. It just makes the inflated OEE look more credible, because it now has a clean interface.
We understand how your business actually works first, then we design the system. For a plant head starting this, the right sequence is: fix the four tracking gaps on paper, agree who owns the cycle time standard, run it manually for four to six weeks, and only then decide what, if anything, needs to be built. That sequencing question, what to fix before you digitise, is the core of how we approach digital transformation for manufacturing clients, and it's covered more broadly in our manufacturing operations hub.
What to do next
Pick one line. Pull its OEE for the last four weeks and ask three questions in the next review: who set the ideal cycle time and when was it last checked, is any stoppage under 5 minutes excluded from the downtime log, and where exactly does a rejected part get logged. The answers will tell you more about the real health of that line than the OEE score itself.
Common questions
What is a good OEE score for manufacturing?
A figure around 85% is widely cited as world class for discrete manufacturing, with most plants running lower. But the score only means something if you know how it was built. A 70% calculated from honest, complete downtime and rejection logs is more trustworthy than an 85% built on padded availability and a loose cycle time standard.
Why does OEE look good on the dashboard but not match what's happening on the floor?
Usually because one of the three inputs, availability, performance or quality, is being measured against a standard that drifted, or because short stoppages and point-of-failure rejections aren't being logged at all. The dashboard is only as honest as the data entered at the machine, and that entry is often done by the person whose performance the number reflects.
Can OEE be calculated manually without software?
Yes. A paper log of run time, stoppage reasons with duration, units produced and units rejected is enough to calculate all three components by hand. Most plants should run this manually for several weeks before digitising it, to make sure the standards behind each number are correct first.
Should shift supervisors' bonuses be tied to OEE?
Be careful if they are. Tying pay directly to a score that the same person can influence by reclassifying downtime, loosening the cycle time standard, or deferring rejection logging almost always improves the number faster than it improves the machine. If incentives are linked to OEE, the standards it's measured against should be owned by someone outside that line.
Sources

Sanket Vanani
Founder & CEO
Sanket Vanani is a business strategist and entrepreneur focused on helping businesses build structured systems for sustainable growth. His work spans sales, operations, manufacturing, process improvement, and business scalability. Through his experience working closely with business owners and teams, Sanket focuses on turning founder-dependent businesses into process-driven organizations that can grow with greater clarity, consistency, and control.
Related reading

Why Your Preventive Maintenance Schedule Never Gets Followed
Preventive maintenance plans fail not from bad scheduling software but from unclear ownership of who stops the line. Here is the fix.
Why Rejection Tracking on the Shop Floor Never Sticks
Rejection tracking fails when it's logged after the shift by someone with no stake in the number. Here's the fix, and who owns it.

Tracking Machine Downtime Without an IoT Budget
Before you buy sensors, learn what six weeks of manual downtime logging will tell you for free.


