
Capacity Planning Without a Spreadsheet: Where It Breaks
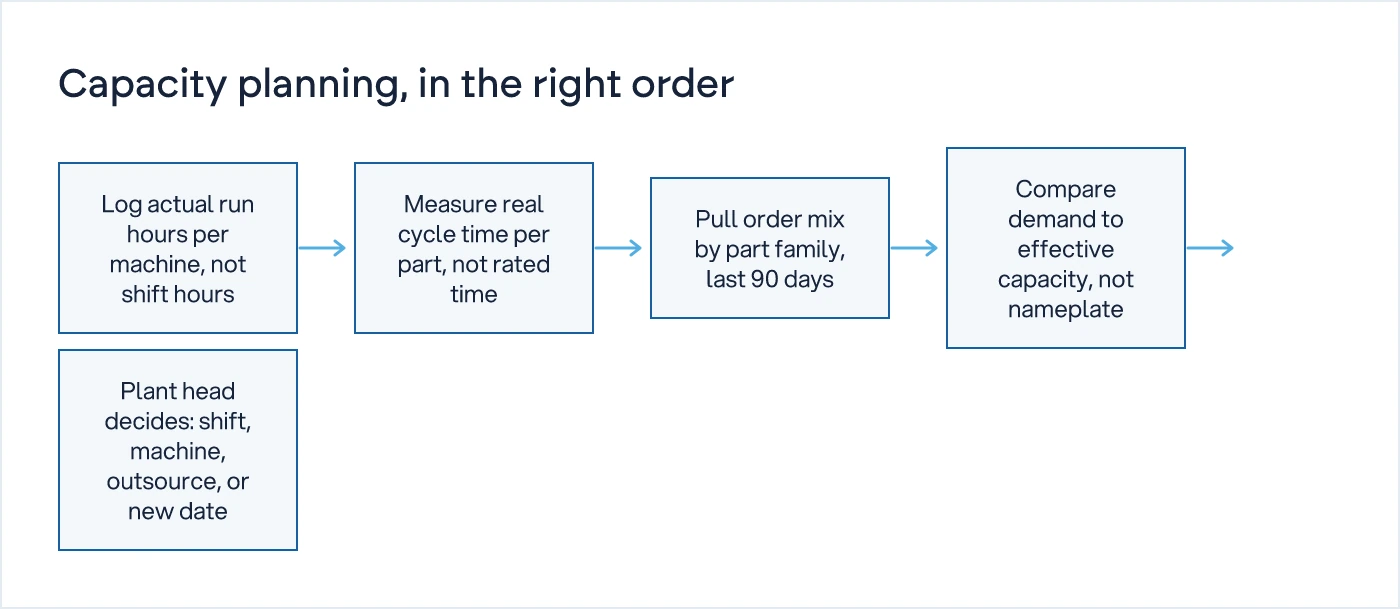
Capacity planning fails because the input numbers are wrong, not because the tool is wrong. Before building any plan, collect three numbers: actual machine hours available after downtime and changeover, real cycle time per part (not the rated one), and your order mix over the last 90 days. Get these right and a spreadsheet works fine.

You take on the new order because the sales team says yes, the plant has machines, and the delivery date is eight weeks out. Three weeks in, the shop floor is running two shifts, the existing customers' orders are slipping, and nobody can tell you, with a straight answer, whether the plant can actually absorb this volume or whether it already couldn't.
This is not a software problem and it's not really a spreadsheet problem either. Most plants that struggle with capacity planning have a spreadsheet. Some have three, maintained by three different people who don't agree with each other. The spreadsheet isn't the issue. What goes into it is.
Why does capacity planning break down even with a spreadsheet?
It breaks down because the numbers feeding it are assumptions dressed up as data. Most capacity plans use the machine's rated output, the standard cycle time from the catalogue, and a rough guess at order volume for the quarter. None of these three numbers reflect what actually happens on the floor.
A CNC machine rated for 1,800 parts a shift might deliver 1,200, after you account for tool changes, operator breaks, minor stoppages nobody logs, and the fact that the first fifteen minutes after a shift change are never productive. If your capacity plan uses 1,800, you will commit to orders you cannot deliver, and you will find out two weeks before the delivery date, not two weeks before you took the order.
This is the same failure pattern we've written about with preventive maintenance schedules and downtime tracking: the system looks fine on paper because the paper is wrong. Capacity planning is downstream of both. If you don't know your actual downtime, you cannot know your actual capacity, no matter how good the plan looks in Excel.
What three numbers do you need before you plan capacity at all?
You need actual available hours per machine, actual cycle time per part, and actual order mix over a rolling period. Everything else in a capacity plan is derived from these three. Get them wrong and the plan is wrong regardless of what tool holds it.
1. Actual machine hours available, not shift hours. Take the shift length, subtract planned maintenance, average unplanned downtime (from a real log, not a guess), changeover time between jobs, and the dead time at shift start and end. What's left is what the machine can actually run. For most plants this is 65-80% of the nameplate shift hours, not 95%.
2. Actual cycle time per part, measured, not rated. The machine manufacturer's cycle time assumes ideal material, ideal tooling, and an operator working at pace with no interruptions. Your floor has none of these consistently. Time ten runs of the same part across different operators and different shifts. Use the average, not the best case.
3. Order mix over the last 90 days, by SKU or part family. Not total order value, not total units. The mix matters because different parts consume the machine differently. A plant running 70% high-volume, low-complexity parts and 30% complex, low-volume parts has a completely different effective capacity than one running the reverse mix, even if the total order count is identical.
Once you have these three, capacity planning becomes arithmetic: available hours divided by cycle time per part, weighted by mix, gives you a realistic throughput number. Compare that to incoming order volume and you have an honest answer to 'can we take this order', instead of a hopeful one.
How is effective capacity different from the number on the machine's nameplate?
Effective capacity is what the machine delivers in practice after every real-world loss is subtracted. Nameplate capacity is what the manufacturer printed on the spec sheet. The gap between the two is usually the entire reason capacity plans fail.
| What the spreadsheet usually uses | What you should measure instead | Where to get it |
|---|---|---|
| Rated output per shift (nameplate) | Actual parts produced per shift, averaged over 4-6 weeks | Production log, not the machine manual |
| Standard cycle time | Measured cycle time across multiple operators and shifts | Stopwatch or MES, averaged, not best-case |
| Planned shift hours (8 or 12) | Shift hours minus downtime, changeover, and start/end dead time | Downtime register (see tracking downtime without IoT) |
| Total order volume for the quarter | Order mix by part family or SKU, last 90 days | Sales order history, not forecast |
| 100% operator availability | Actual attendance and shift coverage | HR/shift roster |
The honest gap between the left column and the right column is usually 20-35%. That's not a rounding error. That's the difference between telling a customer yes with confidence and telling them yes and finding out three weeks later you were wrong.
Who should decide whether to add a shift, a machine, or outsource?
The plant head makes this decision, and they make it with the effective capacity number, not the nameplate number. This has to be named explicitly, because in most plants the decision drifts to whoever is in the room when the order comes in, sales, the owner, or nobody, and it gets decided by default rather than by someone accountable for the outcome.
Once the plant head has effective capacity and the order mix, the decision is a straightforward comparison: if incoming demand exceeds effective capacity for more than a short, defined window, say two consecutive months, the choice is between adding a shift, adding a machine, outsourcing the overflow, or renegotiating the delivery date with the customer. All four are legitimate answers. What's not legitimate is absorbing the gap silently by running the existing team harder until something breaks, whether that's a machine, a delivery date, or a person.
This is also where rejection tracking matters, because rejected parts consume machine hours without producing sellable output. A plant with a 6% rejection rate on a bottleneck machine has 6% less effective capacity than the arithmetic suggests, and most capacity plans don't account for it because rejection data isn't being captured accurately in the first place.
How often should the capacity plan be reviewed?
Monthly, at minimum, and immediately after any week with unusual order volume or unusual downtime. Capacity isn't static. A new large order, a machine breakdown, an operator resignation, or a shift in product mix all change the effective capacity number within days, and a plan reviewed once a quarter is already stale by the time anyone looks at it.
The review itself doesn't need to be elaborate. It needs three inputs refreshed: available hours for the period just closed, cycle times for any new or changed parts, and the order mix for the period ahead. If those three are current, the plan stays honest. If they're not, you're back to planning on assumptions.
Where does this fit with digital transformation, and where doesn't it?
A spreadsheet with the right three numbers, updated weekly by someone accountable for the accuracy, outperforms a capacity planning module fed with nameplate figures and quarterly guesses. Software earns its place once the inputs are reliable and the decision volume outgrows manual tracking, not before.
We understand how your business actually works first, then we design the system. For a plant adding shifts or scaling order volume, that usually means spending the first few weeks on the shop floor measuring actual hours and actual cycle times before a single screen gets designed. If you're evaluating what digital capacity planning should look like once the manual version is solid, our digital transformation service is built around that sequence: fix the input data, then decide what to automate.
What to do this month
Pick your bottleneck machine, the one every delay traces back to. Log its actual run hours for two weeks, time ten cycles of its most common part, and pull the last 90 days of orders by part family. Do the arithmetic by hand before you touch any software. If the number surprises you, that's the real capacity plan starting to take shape. For more on where manufacturing operations break down before they break down visibly, see our other posts in Manufacturing Operations.
Common questions
What is the difference between capacity planning and production scheduling?
Capacity planning answers whether the plant can absorb a given volume of orders over weeks or months, using effective machine hours and cycle times. Production scheduling answers which order runs on which machine today or this week. Capacity planning comes first, it decides whether to accept the order at all. Scheduling only works if the capacity plan behind it is accurate.
How do I calculate machine capacity utilisation?
Divide actual parts produced in a period by the effective capacity for that period, not the nameplate capacity. Effective capacity is available hours (shift hours minus downtime, changeover and dead time) divided by measured cycle time. Utilisation against nameplate capacity will always look lower and more pessimistic than it needs to, because nameplate figures ignore real-world losses.
Should small manufacturers use capacity planning software?
Not before the input numbers are reliable. A plant that hasn't measured actual downtime, actual cycle time, and actual order mix will get the same wrong answer from software that it gets from a spreadsheet, just faster and with more confidence. Fix the data manually for a few weeks first, then decide if volume and complexity justify a dedicated tool.
How much slack should I build into a capacity plan?
Enough to cover the downtime and rejection rate you've actually measured, not a flat percentage borrowed from an industry guide. If your bottleneck machine loses 25% of shift hours to downtime and changeover, and runs a 5% rejection rate, your plan needs to reflect both before you add any buffer for demand uncertainty.
Why does capacity planning fail when order volume suddenly grows?
Because the gap between nameplate and effective capacity, which was tolerable at lower volume, gets multiplied at scale. A plant absorbing the difference informally at 40 orders a month cannot absorb the same percentage gap at 90 orders a month without visible delays, overtime, and missed dates. Growth exposes the bad input data that was always there.
Sources

Sanket Vanani
Founder & CEO
Sanket Vanani is a business strategist and entrepreneur focused on helping businesses build structured systems for sustainable growth. His work spans sales, operations, manufacturing, process improvement, and business scalability. Through his experience working closely with business owners and teams, Sanket focuses on turning founder-dependent businesses into process-driven organizations that can grow with greater clarity, consistency, and control.
Related reading

Why Your Preventive Maintenance Schedule Never Gets Followed
Preventive maintenance plans fail not from bad scheduling software but from unclear ownership of who stops the line. Here is the fix.

Why Rejection Tracking on the Shop Floor Never Sticks
Rejection tracking fails when it's logged after the shift by someone with no stake in the number. Here's the fix, and who owns it.

Tracking Machine Downtime Without an IoT Budget
Before you buy sensors, learn what six weeks of manual downtime logging will tell you for free.


